Fuller, Smith & Turner FY25 results
Continued recovery despite ongoing headwinds, and a valuation that remains attractive.
This post would usually be exclusively for paid subscribers, but I've opened it up to free members as well so you can get a sample of the company updates I send out on a fairly regular basis. In June, I published an update on Ecora Resources after speaking to management at the AGM, and before that, Warner Bros. Discovery following the release of the company's FY24 results.
Still to come this year will be updates on Secure Trust Bank (up 175% since the start of the year but still around 0.5x book value), Jet2, and tinyBuild. I've also got a new Research Report in the works which will be going out in the coming months.
Sign up to a paid subscription for unrivalled analysis at an affordable price.
Next week I will be attending Fuller, Smith & Turner's AGM in London, where the company will be celebrating its 180 year anniversary alongside the retirement of its Chairman, Michael Turner, who has held the role since 2007. In terms of succession, Simon Emeny, the current CEO, will become Executive Chairman, and Fred Turner is being promoted from Retail Director to Chief Operating Officer.
In the following sections, I breakdown the FY25 results and provide an updated outlook and valuation for the company. If you'd like a primer, you can find my original write-up here. Otherwise, enjoy.
FY25 results
Income
Total revenue increased 4.8% to £376.3m (FY24: £359.1m), split between sales of goods and services of £328.3m (FY24: £312.2m), accommodation income of £36.7m (FY24: £35.5m), and rental income of £11.3m (FY24: £11.4m). This can be further broken down into contributions from the managed pubs and hotels, and tenanted inns as follows.
The managed pubs and hotels saw revenue grow 5.3% to £342.7m (FY24: £325.3m), and 5.2% on a like-for-like basis, split between sales of goods and services of £304.4m (FY24: £288.1m), accommodation income of £36.7m (FY24: £35.5m), and rental income of £1.6m (FY24: £1.7m).
Conversely, the tenanted inns saw a modest decline in revenue to £33.6m (FY24: £33.8m), as sales of goods and services to tenants fell to £23.9m (FY24: £24.1m), while rental income remained flat at £9.7m (FY24: £9.7m).
The relative underperformance of the tenanted inns with regard to revenue is largely explained by the sale of 37 non-core tenanted pubs to Admiral Taverns, decreasing the size of the tenanted estate to 153 properties from 190 at the start of the year. The managed estate meanwhile grew to 186 properties (FY24: 180), with the acquisition of Lovely Pubs during the year. Another factor is the higher concentration of managed pubs and hotels within London, where the recovery has been stronger than outside the capital.
While the company now has fewer tenanted inns, they are more profitable, with the average EBITDA per site growing 23% year-over-year, and the overall segment's profit contribution growing 5.1% to £14.4m (FY24: £13.7m). The profit contribution from the managed pubs and hotels segment meanwhile grew by 14.4% to £47.6m (FY24: £41.6m).
At the Group level, operating expenses increased 5.0% to £348.0m (FY24: £331.4m), including £12.1m (FY24: £6.8m) of separately disclosed items primarily comprising property impairments. Excluding these separately disclosed items, operating expenses saw a more modest 3.5% increase to £335.9m (FY24: £324.6m).
The table below breaks down the operating expenses into its component parts. As you can see, the largest rise on an absolute basis was staff costs, which grew by £8.0m to £137.9m (FY24: £129.9m). Also notable, was a slight fall in production costs/cost of goods sold and utility costs, stabilising after a period of significant inflation.
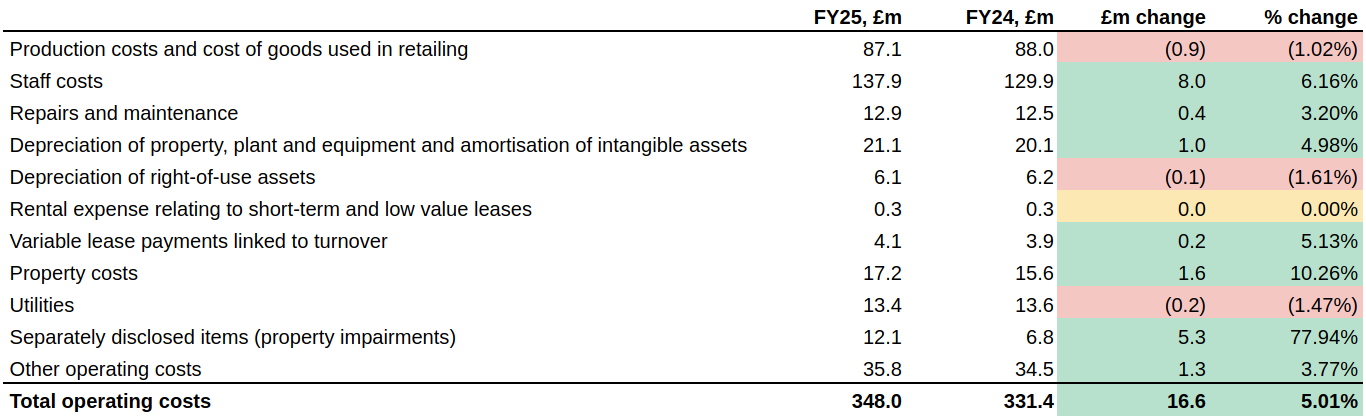
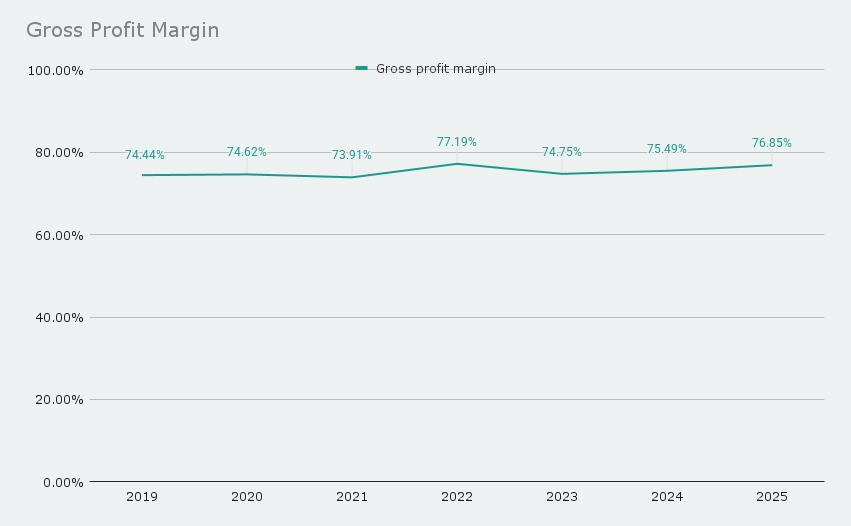
Using the production costs and cost of goods sold in isolation to derive the gross profit, we can see that the gross profit margin has remained relatively stable through all the turbulence of the last 5 years, and is actually starting to tick up a little. Obviously increases or relative inelasticity in other expenses has led to a far less smooth ride at an operating profit level as we'll see further down.
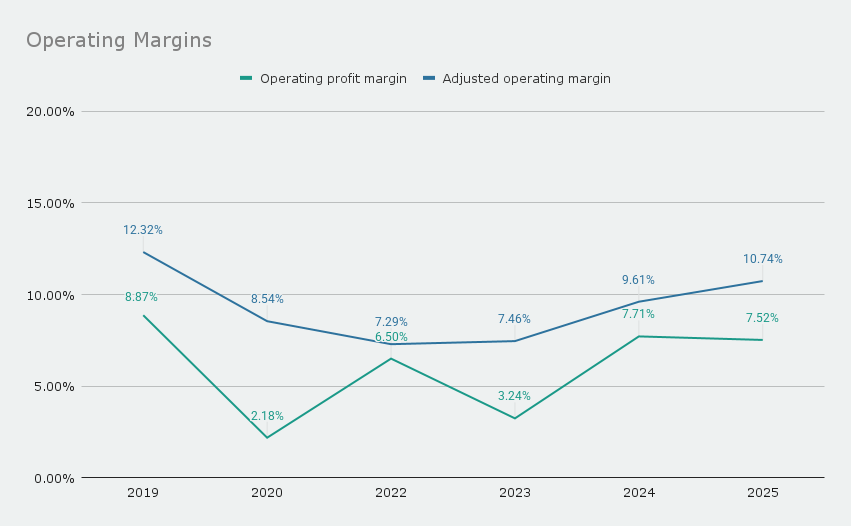
Subtracting the operating expenses from revenue we get an operating profit of £28.3m (FY24: £27.7m) - or £40.4m (FY24: £34.5m) on an adjusted basis. Operating margins, calculated on both a statutory and adjusted basis, have seen a substantial recovery over the last few years, and are nearing their pre-pandemic level.
Rising labour costs are going to provide a headwind in the next year, but I'd expect continued margin growth over the medium term as profits trend back towards a normalised level. We'll discuss management's targets, which give us an idea of the earnings trajectory, in a moment.
Note: I've excluded 2021 from the chart below as trading effectively ceased for most of that year.
From the operating profit is deducted £13.4m (FY24: £13.3m) in net finance costs, offset by an £18.9m (FY24: nil) profit on disposal of properties - principally attributable to The Mad Hatter in Southwark - to get a profit before tax of £33.8m (FY24: £14.4m). Excluding the gain on property disposals, and the aforementioned items, gives the adjusted profit before tax of £27.0m (FY24: £20.5m).
As a brief aside, I recently stayed at The Mad Hatter and you can easily see the value of the property location. It's situated a stone's throw from the Tate Modern gallery, and easy walking distance from many other attractions, such as The London Eye, Palace of Westminster, and The National Gallery.
Adjusted profit before tax is a key performance indicator for management, used to determine 80% of the annual bonus paid to Executive Directors. The performance range for the FY25 bonus was £22.57-26.87m with a target of £24.72m. They obviously exceeded their target by quite some margin, resulting in the maximum payout.
The company also has a long term incentive program (LTIP) which pays out shares to the Executive Directors on the basis of pre-tax adjusted earnings per share (EPS) performance. The awards vest 3 years after grant, so the LTIP awards granted in FY22 were due to vest in FY25. However, the actual pre-tax adjusted EPS of 47.15p did not meet the 49.93p threshold, and as a result the awards lapsed.
For the LTIP awards granted as part of the FY26 remuneration policy vesting in FY28, the pre-tax adjusted EPS target range has been set as 53.04p-69.85p (FY25 awards vesting in FY27: 43.00p-58.99p).
Net profit for the year came to £27.2m (FY24: £9.1m), or 47.49p (FY24: 15.16p) on a per share basis, after subtracting corporation tax of £6.6m (FY24: £5.3m). Adjusted for the net positive contribution from separately disclosed items and associated tax movements, the figure becomes £19.6m (FY24: £14.7m) or 34.22p per share (FY24: 24.48p).
One final thing to mention before moving on to the current financial position, is the sale of the company's pension scheme assets to purchase an annuity, taking advantage of the prior surplus and removing the risk of any future deficit should the asset values fall. This did however result in a net actuarial loss - equal to the prior surplus - being recognised in the statement of comprehensive income, as the assets were passed to the insurance company and replaced with an annuity matching the value of the pension liabilities.
Financial position
Total equity decreased by 4.5% to £411.7m (FY24: £431.3m), as capital returned to shareholders through share repurchases and dividends exceeded the total comprehensive income for the year. However, the net effect of repurchasing shares at a discount to book value was a 1.6% increase in book value per share to £7.45 (FY24: £7.33).
Now, as discussed in prior articles, the properties are carried at cost unless impaired, meaning any upward movement in fair value is not recognised. Based on a portfolio valuation conducted in FY22, the true net asset value per share is likely to be significantly above £10 per share - back in 2023 I estimated it at £13.80, but it has probably moved since then.
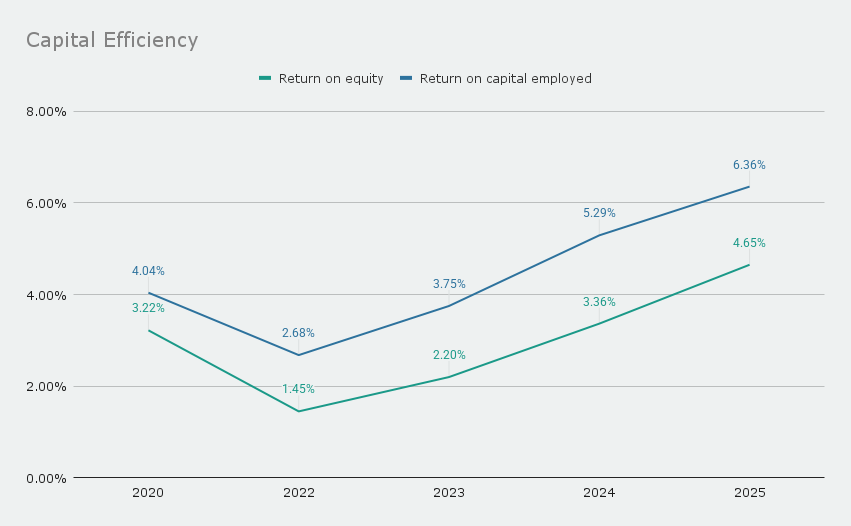
Capital efficiency has improved markedly over the last five years, with return on equity (calculated using adjusted profit after tax) hitting 4.65% in FY25 (FY24: 3.36%) and return on capital employed (calculated using adjusted operating profit) hitting 6.36% (FY24: 5.29%). In the medium-term, I would expect to see both these figures reach high single digits as earnings normalise.
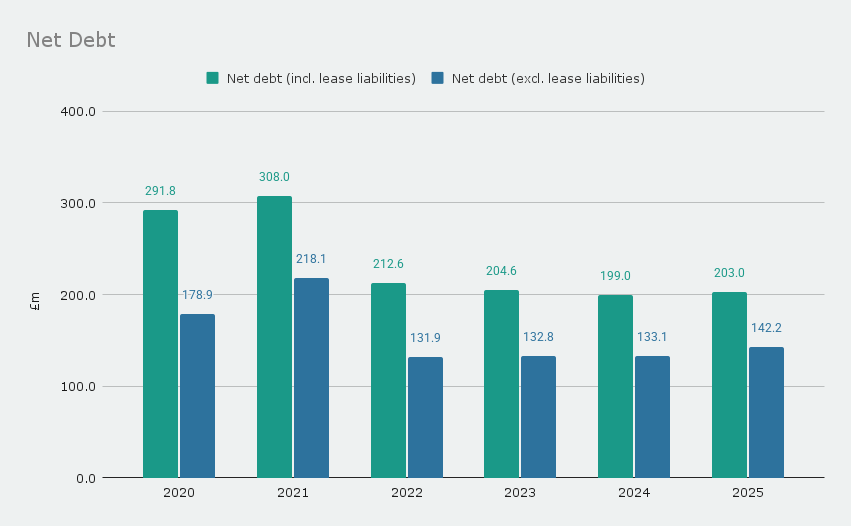
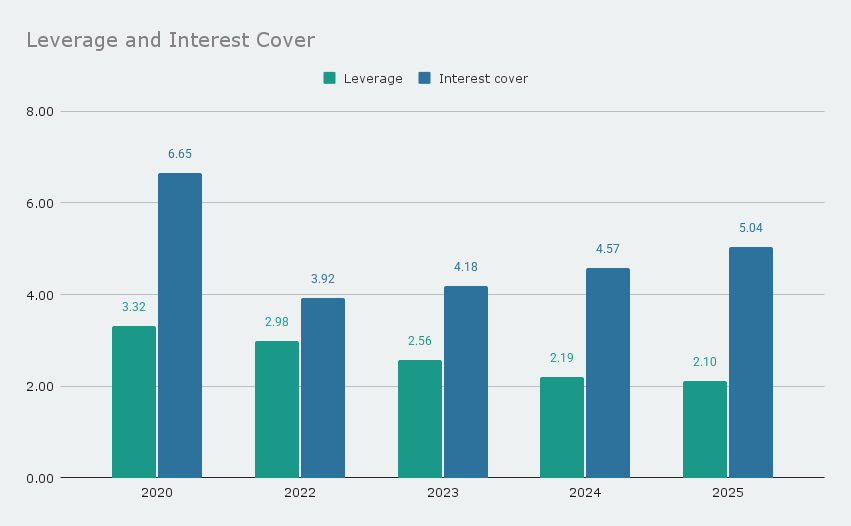
Net debt has seen a modest rise to £142.2m excluding lease liabilities (FY24: £133.1m) and £203.0m including them (FY24: £199.0m), but leverage and interest cover have both improved. Leverage (calculated as net debt excluding lease liabilities divided by adjusted EBITDA) has decreased to 2.10 (FY24: 2.19) and interest cover (calculated as adjusted EBITDA divided by net finance costs) has increased to 5.04 (FY24: 4.57) - both well within the debt covenants.
Speaking of which, the company has secured a new lending facility with a syndicate of five banks totalling £185m and available until 31 Aug 2028. The facility is split between a revolving credit facility of £100m and a term loan of £85m, with an interest margin dependent on the company's leverage plus SONIA. The immediate result was a 75bps reduction in interest margin compared with the prior facility.
Cash flows
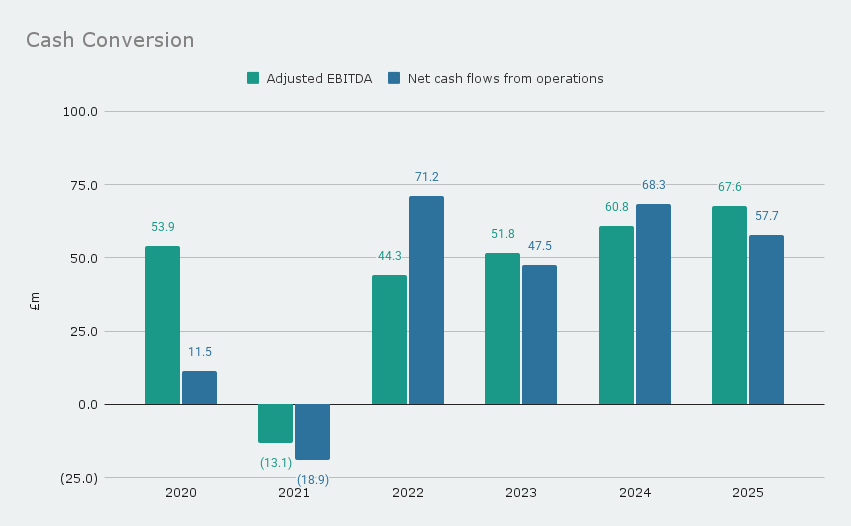
Cash conversion remained strong, with operating cash flow generation of £57.7m (FY24: £68.3m) from adjusted EBITDA of £67.6m (FY24: £60.8m).
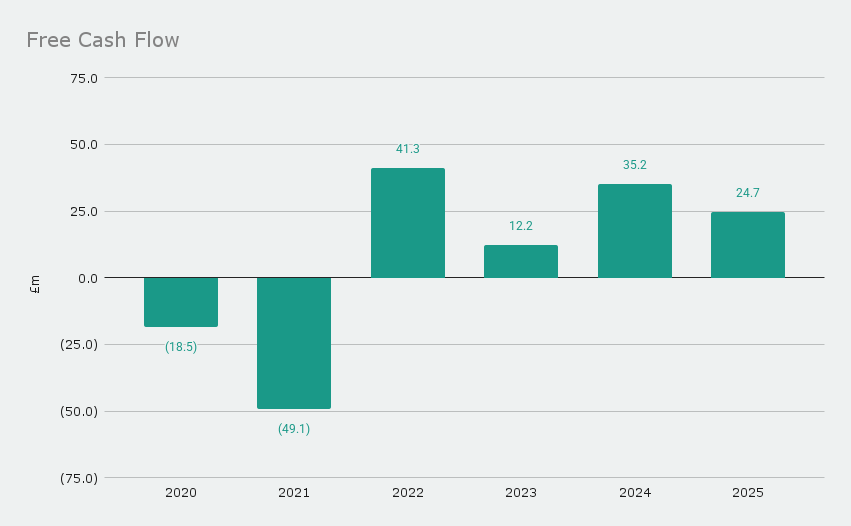
After subtracting debt interest, lease repayments, and maintenance capex, we get c.£24.7m (FY24: c.£35.2m) of free cash flow, which was used alongside the proceeds of property sales and a modest increase in net debt, to distribute £10.7m (FY24: £10.0m) to shareholders in dividends, £23.9m (FY24: £12.4m) through share repurchases, and invest a further c.£39.3m (FY24: c.£13.6m) in expanding and enhancing the estate. Note: there's an element of estimation in calculating maintenance capex, and therefore free cash flow, as the company doesn't disclose an exact figure. Management have previously stated however, that it typically ranges between £10-15m or c.50% of overall capex.
Outlook and valuation
As discussed in my last update, the changes to employers' National Insurance contributions and the minimum wage are expected to increase the company's wage bill by £8m - around the same increase seen in FY25. The performance targets set by the Board factor this in, but still indicate an expectation of continued earnings recovery in the short-to-medium term.
There is however no denying the market has soured on the company and sector more generally, visible in the share price decline since the Autumn Budget. Not withstanding a partial rebound in the aftermath of Trump's tariff shock, shareholders have lost most of their gains from 2024.
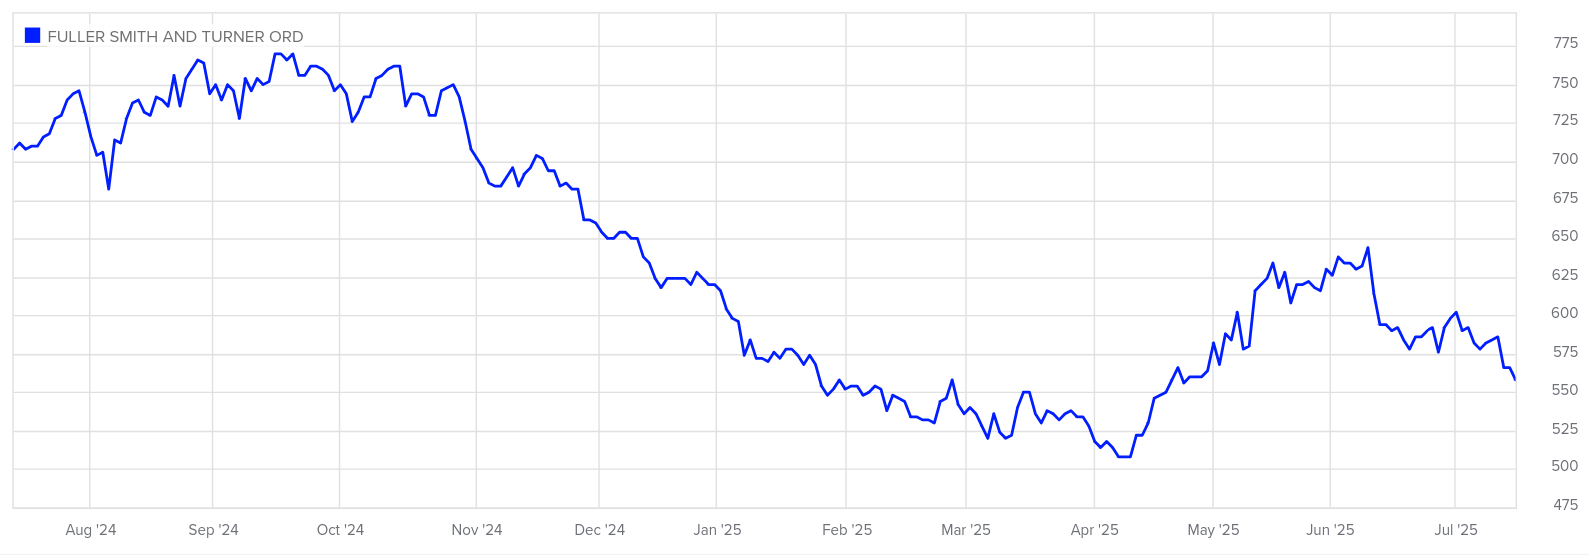
So where does this leave us now in terms of valuation? Well using a share price of £5.58, the shares trade at 0.75x book value and likely <50% liquidation value. The adjusted earnings yield (lower than the statutory earnings yield due to profits on property sales) is currently 6.1% and somewhere around 10% on a normalised basis. Looking at hard cash returns, the shares currently offer an 8.0% free cash flow yield, 3.2% dividend yield (after factoring in the proposed 11% increase to the final dividend), and 7.7% buyback yield. Note: share repurchases are still underway at time of writing, but I wouldn't necessarily count on them being as high as last year unless the company turns to debt to finance them.
I would therefore say the valuation remains attractive, and intend to continue holding after adding to my position in February and April this year.