Fuller, Smith & Turner Research Report
Business overview
Fuller, Smith & Turner (Fuller's) is a hospitality business listed on the London Stock Exchange with a market capitalisation of c.£312m. The company owns and operates a portfolio of pubs and hotels located in the South of England, which are divided into Managed Inns, directly operated by Fuller's, and Tenanted Inns, leased out to entrepreneur managers.
The company also used to own a brewery and wholesale drinks business, but sold this to Asahi in 2019 for total proceeds of £250m. The intent of that divestment was to focus the company's resources on the core pubs and hotels business that generated 87% of operating profits in FY2019. As part of the sale, they signed a Long-Term Supplier Agreement (LTSA) extending out to 2029, wherein Asahi will continue the supply beer and other drinks to Fuller's pubs, with price rises capped at CPI.
As of 26 Mar 2022, the property estate totalled 385 properties - 211 Managed and 174 Tenanted. The Managed properties can be further divided into 76 urban, 96 suburban, and 39 rural - including 8 pubs from the acquisition of Bel & The Dragon in June 2018 and 7 hotels from the acquisition of Cotswold Inns & Hotels in October 2019.
The company's diverse estate includes locations ranging from the City of London, to airport terminals, and picturesque villages. This allows them to cater to a mix of customer groups, but in general they are targeting the more affluent. In this regard they benefit from 21% higher hospitality spend in their regions vs the UK average and 19% higher incomes.
The pubs are operated locally and treated as independent cash generating units (CGUs), with general managers given a free reign over decor, food&drink menus and entertainment, allowing them to tailor their offering to local clientele. This can be seen in City pubs offering a range of cocktails for younger customers coming in after work, or rural pubs providing a selection of fine wines and accompanying dishes to more mature patrons.
In this respect they are able to flexibly compete with their independent peers. However, being part of a larger company with central facilities does confer some decided advantages. First amongst these is centralised purchasing, which allows each pub to reliably secure the food, drink and other supplies they need at the discounts afforded by buying in bulk. This was ever more important during the supply chain disruption that occurred during the pandemic.
The individual pubs also benefit from a centralised IT and booking system, that includes targeted digital marketing using data acquired from across the group. The company recently completed a digital transformation project which has significantly increased its digital capabilities. This includes a new mailing system that allows them to contact customers on a regular basis and track response rates and associated spend. The data fed back from these email campaigns has helped to identify the offers and events that most interest their customers, and has also better defined the target audiences for digital advertising.
Another aspect of the digital transformation project was the implementation of a new hotel booking engine, that integrates directly with metasearch platforms such as Google, Trivago, and TripAdvisor. This has made it easy for customers to book directly with Fuller's rather than going via online travel agents (OTAs) - avoiding commission payments and building digital relationships with customers. They have also built in the opportunity for auxiliary sales, such as allowing customers to book a table for dinner at the same time as booking a room. Future developments in their pipeline include adding a loyalty scheme, to further increase the incentives to book direct and help generate recurring revenue.
The company offers its employees meaningful career paths that help it to attract and retain talent. This is illustrated by the fact that 60% of general managers joined the company in entry level roles. Every year they take on over 100 apprentice chefs who are trained in the company's Chef's Guild, with a clear career pathway right up to Executive Chef level.
In an inspired collaboration, Fuller's has sponsored the UK national team in the international Bocuse d'Or cooking competition. This has given them access to top Michelin star Chefs, including Simon Rogan and Ashley Palmer-Watts, who have designed an exclusive range of dishes branded "Only at Fuller's", available at select Fuller's pubs and taught at the Chef's Guild.
The ability to attract and internally develop talent creates a steady flow of new general managers to run the expanding estate. This allows the company to scale without lowering its quality, as internally trained managers already have an understanding of operations from being a part of them.
The Tenanted Inns are a highly profitable part of the business that operates under a franchise type model, whereby the company receives income from rent payments that scale with pub revenues, and from sales of food/drink to the Tenants on a wholesale basis. Lease agreements usually span 3 to 5 years and include annual price increases in line with inflation. Pubs can also move from Managed to Tenanted and vice versa depending on what is deemed to be the most profitable use of the property at a given time.
In response to the inflationary pressures on utilities expenses, Fuller's has been trialling a project allowing tenants to purchase their utilities through Fuller's, in much the same way they buy their inventory, thereby benefiting from the buying power and hedging capabilities of the wider group.
When signing on new tenants, the company ensures they have very low levels of debt relative to the capital they are investing into the enterprise. This substantially limits the risk of insolvencies across the Tenanted estate.
Ownership structure
The company's share structure is complicated by the fact that it is still largely family controlled, with the family members having their own share class. In total there are three share classes: A, B, and C. The A shares are publicly listed, while the B and C shares, held by the family members and company executives, are unlisted and have certain restrictions.
The A and C shares both have a nominal value of 40p and the B shares have a nominal value of 4p. This reflects the fact that in most matters B shares carry 1/10th of the value of A and C shares, with the exception being voting rights, where all share classes are equal. Using the share counts from the FY2022 annual report, the proportionate voting rights were 28.6%, 62.0%, and 9.4% for the A, B, and C share classes, respectively. In contrast, the profit entitlements were 64.7%, 14.0%, and 21.2%, respectively.
As mentioned above, the unlisted B and C shares have certain ownership and conversion restrictions. Holders of the C shares have the opportunity to convert them to A shares (which can then be sold on the stock exchange) twice yearly, provided at least 30 days notice is given prior to the release of the full-year and half-year results. The B shares cannot be converted to any other share class and have transfer restrictions ensuring they are kept within the holder's family. Management are also issued B shares as part of their share-based compensation.
The fact that a controlling ownership share is unlisted, protects the company from hostile takeovers - something that can be a real threat when the stock is trading cheaply. However, since public shareholders have little say over the election of management, they have to place their trust in the controlling families to select Directors that will manage the business in their best interests. In this regard, family ownership can be a double-edged sword, but in the case of Fuller's I think it is a net benefit.
A little bonus that's worth mentioning is that holders of at least 1,000 A shares are eligible to receive a shareholder indulgence card, entitling them to discounts at Managed Pubs and Hotels.
Balance sheet
As of 24 Sep 2022, the company had non-current assets totalling £714.9m, of which the largest components were £591.8m for property, plant and equipment, £69.2m for right-of-use assets, £22.0m for retirement benefit obligations, and £29.3m for intangible assets. The right-of-use assets relate primarily to the 8% of the property estate held under leases rather than freeholds, and the majority of the £29.3m of intangible assets relates to goodwill recognised from the acquisition of the Gales estate back in 2005.
The value of the property estate recognised on the balance sheet is based on a valuation dating back to 1999. In FY2022, management conducted a revaluation that produced a significantly higher figure of £995.6m. This figure was was calculated by applying an appropriate multiple to the earnings of each property, and an external Chartered Surveyor was employed to provide independent valuations on 20% of the managed estate. An average multiple of 11.8x was applied to managed freehold assets, 3.3x to managed leasehold assets, and 10.9x to tenanted assets.
Set against these non-current assets is £239.2m in non-current liabilities, comprising £149.6m in borrowings, £71.6m in lease liabilities, £16.4m in deferred tax liabilities, and £1.6m in retirement benefit obligations. The borrowings represent the amount drawn from the company's £200m credit facility, which is split between a £110m revolving credit facility and a £90m term loan. The interest rate margin on borrowings from this credit facility is dependent on the leverage covenants - net debt to EBITDA and interest cover ratios - plus SONIA (sterling overnight index average).
Due to the enforced closures during the pandemic, the company had to take out significant loans to keep the business afloat while it was unable to trade. This included the issuance of £100m of commercial paper to the Bank of England under the Covid Corporate Financing Facility (CCFF), alongside private sources of credit. In April 2021, the company completed an equity placing which raised £51.8m, subsequently used to repay some of this debt. The remaining borrowings were then rolled into the new £200m credit facility which extends out to May 2026.
It's also worth noting that during the pandemic the loan covenants were broken, but subsequently waived and replaced with a minimum liquidity requirement of £10m, tested each month. The covenants have since gone back to EBITDA multiple and interest cover requirements, after the refinancing that took place in May 2022.
The management has stated that their target leverage ratio (net debt/EBITDA) is 3x, and they plan to use their credit facility to finance continued acquisitions. While capex on the existing estate is funded by cash flows from operations, debt is being used as a structural component of the business to fund inorganic growth. The company's large portfolio of freehold property assets makes it relatively easy for them to secure the required financing to sustain this model, but there is an element of risk as they will need to periodically refinance their debt as it becomes due.
Moving to the current portion of assets, the total came to £42.7m, divided between £20.4m of cash and short-term deposits, £17.9m of trade and other receivables, £4.3m of inventories, and £0.1m of current tax receivable. Set against this was total current liabilities of £69.6m, comprising £63.1m of trade and other payables, £6.0m of lease liabilities, and £0.5m of provisions.
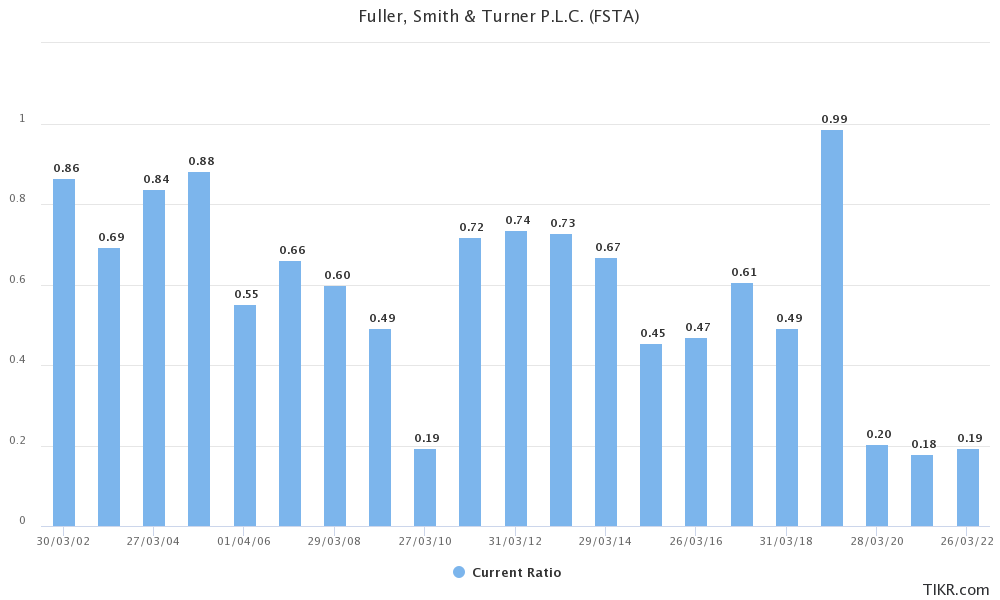
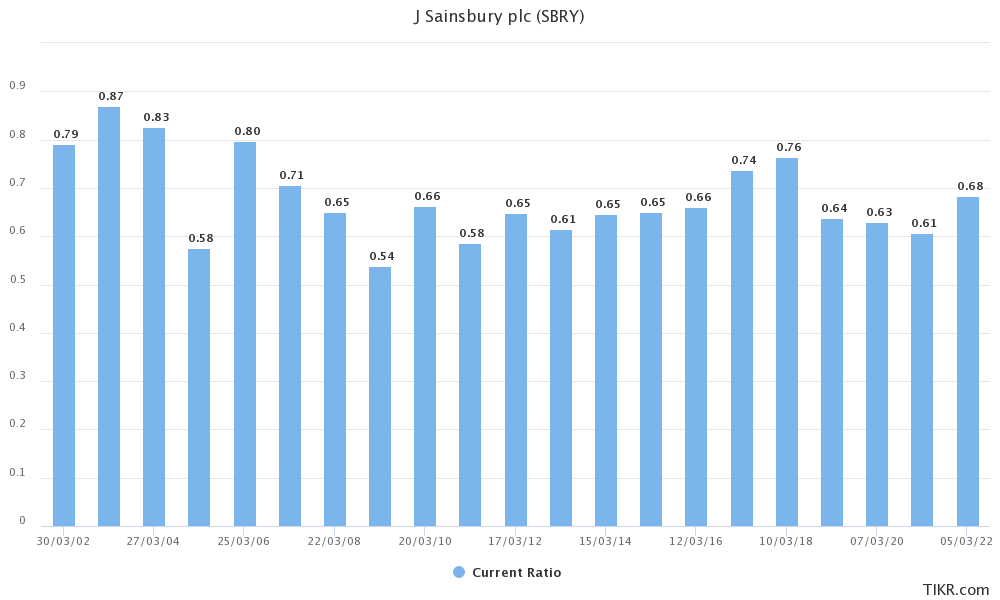
It's apparent from these figures that the current ratio (0.61) is significantly below 1. Looking back at the historical data, this seems to be how the company has been run, with periods where this ratio is exaggerated by debt becoming due. This current ratio is similar to that seen for supermarkets and other businesses with a high turnover of perishable inventory (see charts below).
Subtracting the total liabilities from the total assets gives us a total equity figure of £457.1m, equating to a net asset value (NAV) per share of £7.41. If the more recent estate valuation is used, this NAV per share figure becomes £13.80.
Income
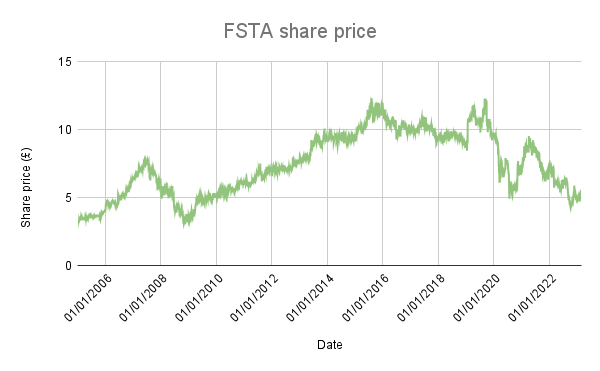
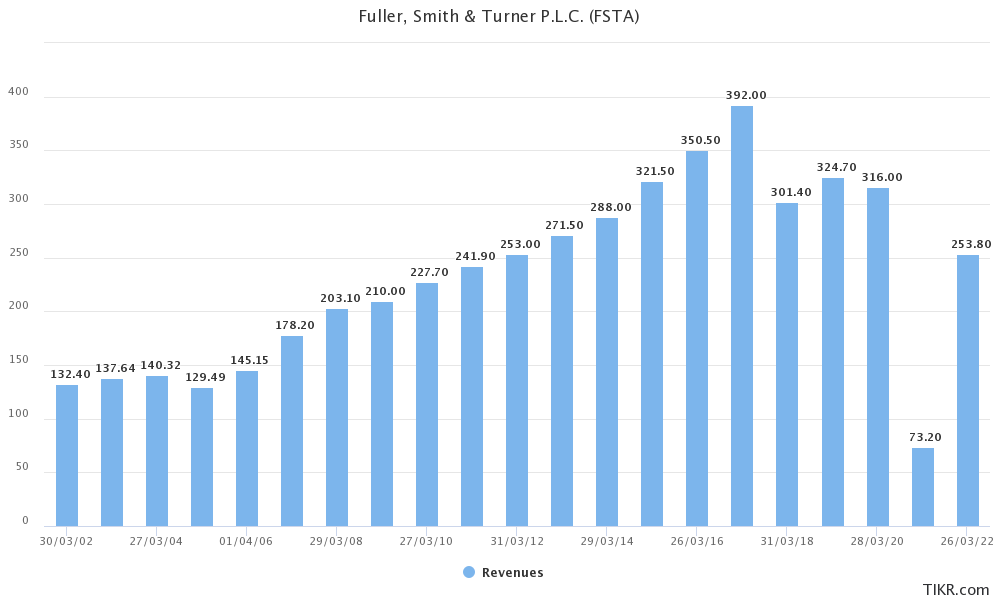
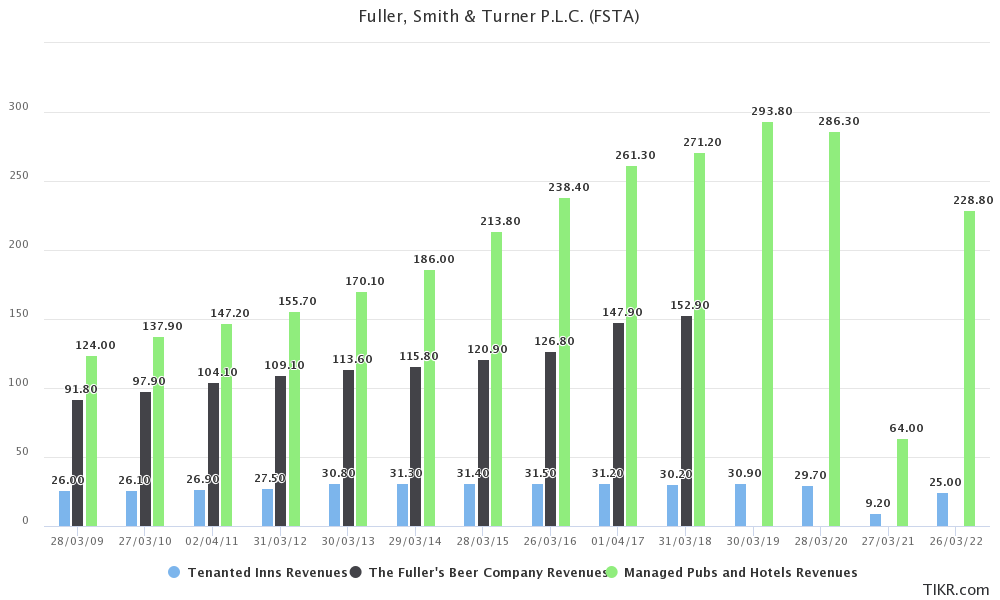
The annual revenue figures for the last 20 years show a steady upward trend leading up to the sale of the brewery business in 2018/19, which reset the baseline to around £300m, and then the dramatic drop in 2020/21 due to the pandemic lockdowns. Something notable here is that the recession of 2008 had no noticeable impact on their sales, which speaks to the benefits of operating in the premium segment of the market.
As can be seen from the chart below, the managed pubs and hotels business drove most of the revenue growth seen from 2009 onwards.
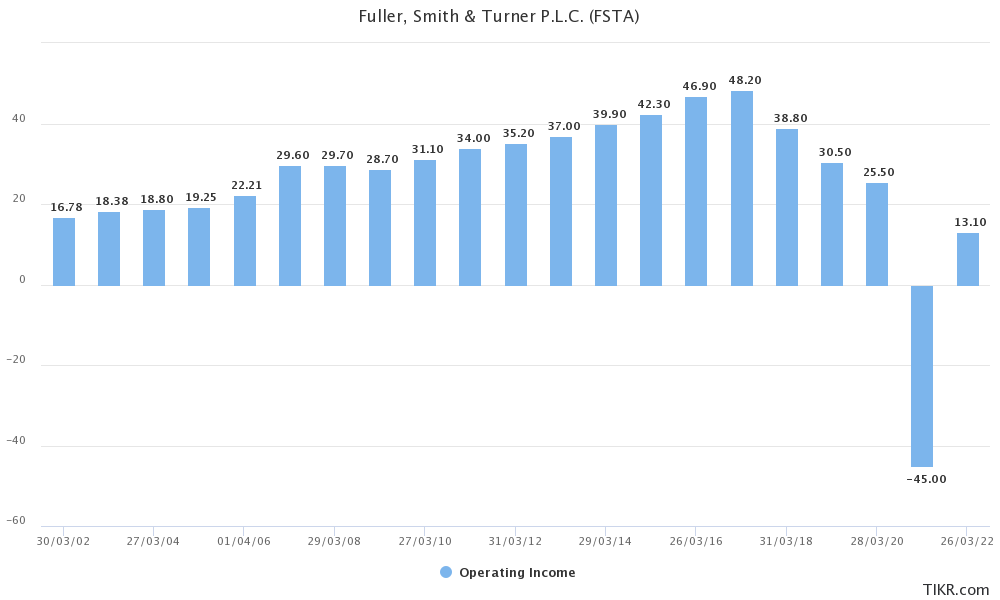
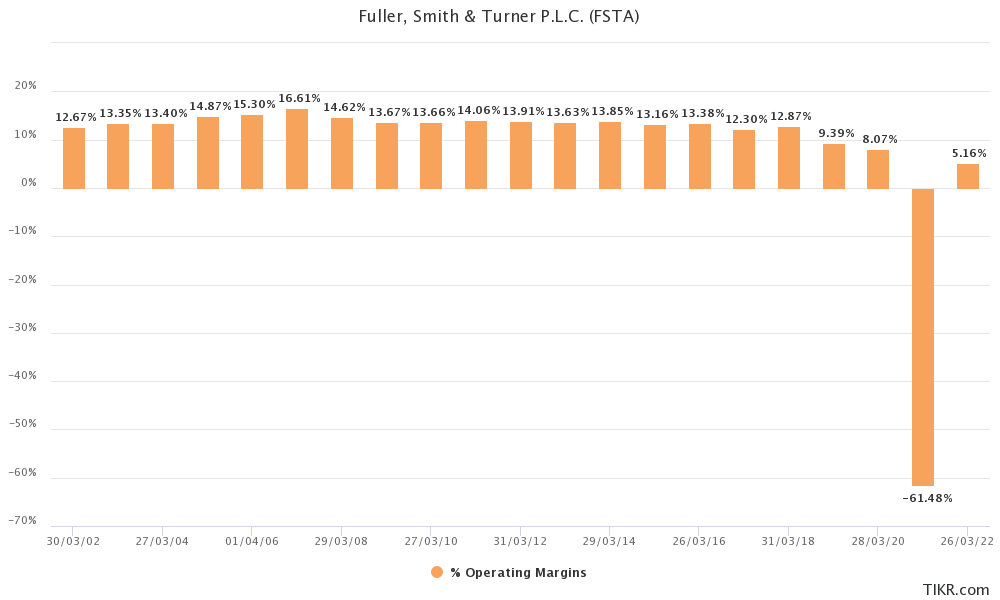
Operating income shows a similar trend to revenue, and remained positive in all of the last 20 years excluding FY2021, where it turned steeply negative. Operating margin remained pretty consistent over this period, averaging 13.30% in the 19 years before the pandemic, though with a notable decrease in FY2019 and FY2020 after the sale of the beer business - hard to pinpoint the cause exactly.
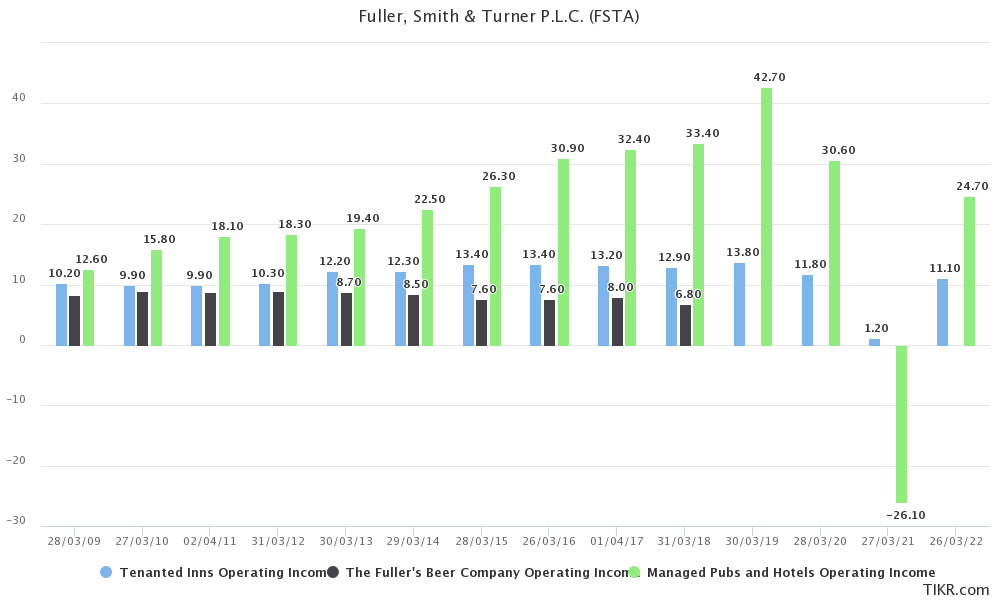
Looking at the segmental split of operating income we can see that the beer business had significantly lower operating margins (4-6%) than the managed pubs and hotels business (>12%), and the tenanted inns business (>40%).
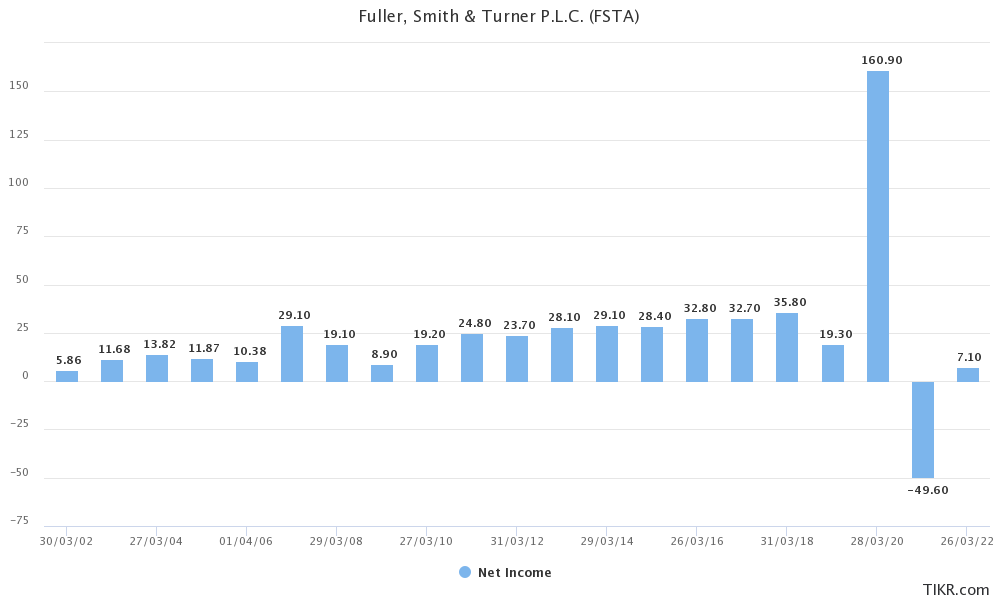
The company's net income has been a little more lumpy than the operating income, but has still been positive in all of the last 20 years except FY2021. There was an anomalous spike in FY2020 due to the proceeds from the sale of the beer business.
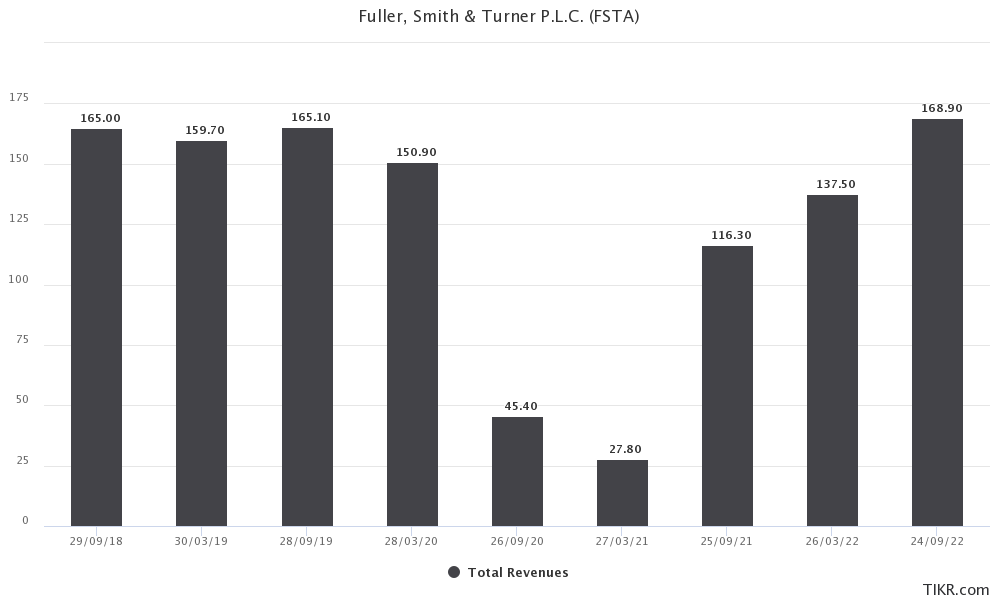
Looking at the semi-annual revenue figures, we can see that revenues in H1 2023 have nominally recovered to pre-pandemic levels. However, this does not account for the substantial inflation that has occurred over between then and now; on a real basis, sales are still a little down but on a positive trend towards recovery.
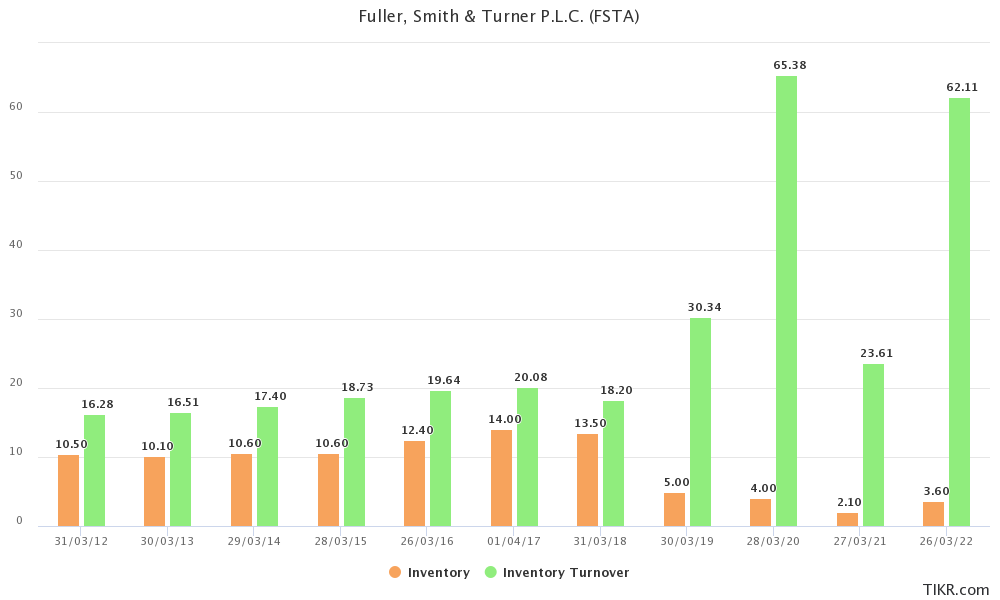
One final thing I want to mention while addressing the income statement is inventory turnover, which you can see increased substantially after the sale of the beer business, due to the consequent reduction in inventory held on the balance sheet (with a slight lag effect due to inventory turnover using the average inventory).
Cash flows
Like the income figures, cash flow from operations (OCF) has been positive in all of the last 20 years except FY2021. Free cash flow (FCF) has had a few negative years, due to capex being somewhat lumpy at times.
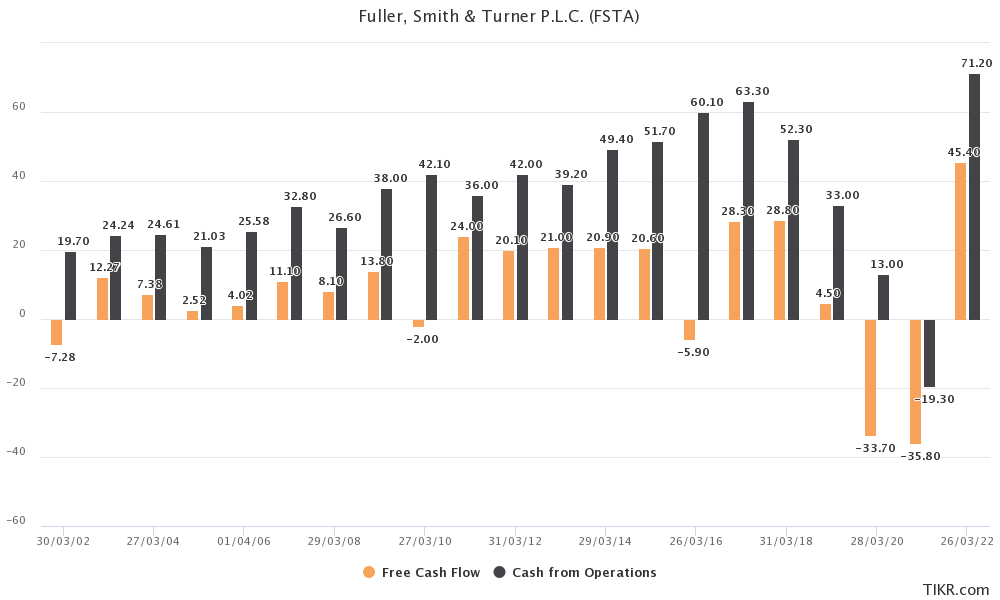
FCF is perhaps not the cleanest metric here, since the split between maintenance capex and enhancement capex is roughly 50% in most years. Factoring this in, you'd expect the gap between OCF and FCF to halve. To put this into hard numbers, management has outlined a policy of spending in the region of £20m-£30m on capex investment, which would equate to £10m-£15m on both maintenance and enhancement capex. In FY2022, they spent £26m and in H1 2023 they spent a further £12m.
Just to clarify what constitutes enhancement capex, examples could include capacity expansion (e.g. increasing the number of rooms in a hotel or the number of tables in a restaurant) and efficiency improvements. Both of these examples would improve the profitability of a pub/hotel and so extend beyond simple maintenance.
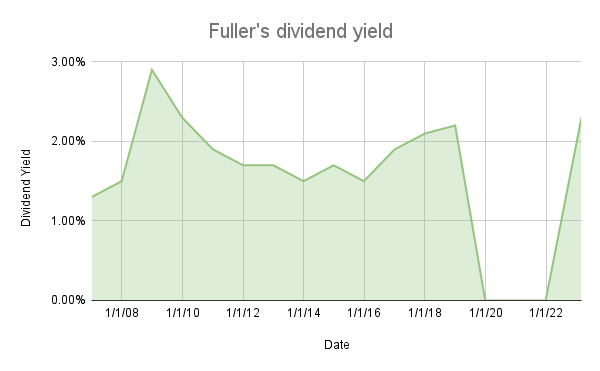
Prior to the pandemic, the company had a progressive dividend policy extending back seven decades, with a target dividend cover of 2.5x-3.0x - equating to a payout of 33%-40% of profits. The compound annual growth rate (CAGR) for the 18 years prior to the pandemic was 6.41% and the historical average yield since 2006 has been c.2% (see graphs below).
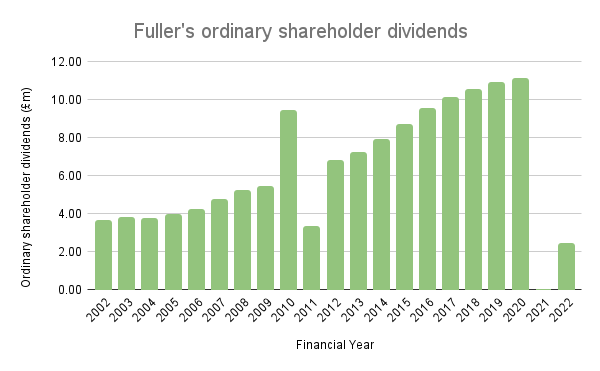
In FY2022, a total dividend of £7.0m was paid to ordinary shareholders, equating to 11.31p per share, split between a 7.41p final dividend and a 3.9p interim dividend.
The company also engages in share repurchases, though largely to nullify the dilutive effect of share-based compensation. In H2 2023, 1 million A shares were repurchased for this purpose.
Management
Chief executive Simon Emeny has been with Fuller's for more than 25 years. He was appointed to the board as Retail Director in May 1998, subsequently becoming Managing Director of Fuller's Inns in July 2006, followed by Group Managing Director in November 2010, and then Chief Executive in July 2013. He has also held a number of Non-Executive Directorships including Senior Independent Director at Dunelm Group plc and WHSmith plc.
Chairman Michael Turner is a Chartered Accountant, and joined Fuller's in 1978, initially as Wine Director before being appointed Marketing Director in 1988, Managing Director in 1992, Chief Executive in 2002 and Chairman in 2007. As you can probably guess from his surname, Michael is also a member of one of the founding families.
Neil Smith, appointed Finance Director in November 2021 to replace Adam Councell, was previously Chief Financial Officer at Domino's Pizza Group plc, and before that CFO of Ei Group plc (the UK's largest pub company before it was acquired by Stonegate Pub Company in March 2020). He's also a Chartered Accountant.
Fred Turner, another family member, is a Chartered Accountant and currently serves as Retail Director.
There are two non-executive directors who represent the Fuller family, namely Sir James Fuller and Richard Fuller, along with three independent non-executive directors: Juliette Stacey, Helen Jones, and Robin Rowland OBE. All have considerable experience in areas relevant to the company. The final board member is Rachel Spencer - the company secretary.
In November 2022, the company added a new member to its executive team: Sam Bourke. Sam is joining the company as Marketing Director, a role she has previously held at both Wasabi and The Restaurant Group (owner of a number of restaurant chains including Wagamama, Frankie&Benny's, and Chiquito).
Because the business is still family controlled, it doesn't comply with several principles of the UK Corporate Governance Code. Specifically, the requirement that at least half the board, excluding the Chairman, are independent non-executive directors, the requirement that directors are subject to annual re-election, and the limitation that the Chairman be in post for no more than nine years.
Executive compensation
The Executive compensation consists principally of a base salary, a performance dependent bonus, and a share-based long term incentive plan (LTIP). The LTIP shares have a £nil vesting price meaning they're grants rather than purchase options.
The base salaries for the Chief Executive, Finance Director, and Retail Director from 1 June 2022 were £525,300, £363,000, and £210,000, respectively. This was after a 3% increase in line with the wider workforce.
The maximum bonus is 100% of base salary, of which 80% is determined by Group adjusted profit before tax and 20% on individual business objectives (this was 70:30 in FY2022). In FY2022, the total bonus payout was 61% of base salary. Bonuses earned above 75% will normally be deferred into shares for three years.
For the FY2022 LTIP, the Chief Executive and Retail Director were granted awards of 125% of base salary, and the Finance Director was granted an award of 100% of base salary. These awards will vest based on pre-tax adjusted EPS performance for FY2024, with a threshold of 44.89p per share and a maximum of 54.68p per share. 25% of awards vest for threshold levels of performance.
There was an additional recovery LTIP award granted with a maximum opportunity of 250% of base salary. This was to incentivise management to stay with the company and help it recover from the impact of the pandemic lockdowns. The award will vest based on adjusted EBITDA targets for FY2024 with a threshold of £55m and maximum of £73m. While an adjusted EBITDA target is not as aligned with shareholder returns as EPS, it does seem appropriate for an award focused on business recovery.
The FY2023 LTIP awards will be granted at the same percentage levels as the FY2022 awards (125% and 100%), and will vest based on adjusted EPS performance for FY2025, with a threshold of 49.93p per share and a maximum of 60.15p.
LTIP awards granted in 2019 were based on Group adjusted EPS performance for FY2022, but the threshold was not met and so the awards lapsed.
Executives are required to hold shares worth at least 200% of their salary. Based on the share price on 26 March 2022 of £6.20, Simon Emeny, Fred Turner, and Neil Smith held shares with a value of 281%, 448%, and 10% of salary, respectively.
Since being appointed Chief Executive in July 2013, Simon Emeny has had a good record of achieving his performance targets, with annual bonus and LTIP awards averaging greater than 50% of the maximum available (excluding the years affected by the pandemic). By this historical precedent, we can probably expect the future EPS and adjusted EBITDA to be within the target ranges specified.
Valuation
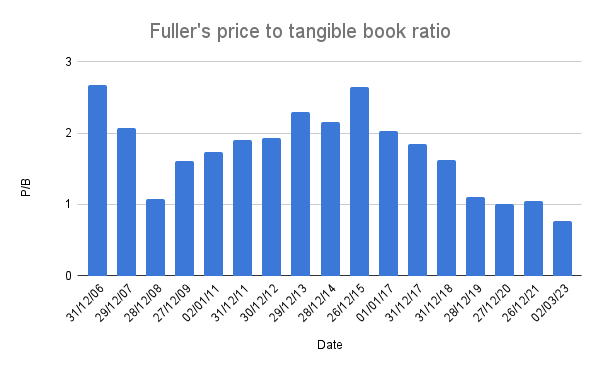
As a company with very significant tangible assets, there are a number of ways to go about valuing Fuller's, but let's start with book value. Comparing the last reported book value of £457.1m (£7.41 per share) to the current market capitalisation of £312m (with share price of £5.14), the price to book ratio (P/B) is 0.68. This presents a significant discount, which becomes much wider if you incorporate the more recent estate valuation that raises book value to £838m (£13.80 per share) making the P/B 0.37.
With the 1999 estate valuation, Fuller's has historically traded for around 1.5x book value as can be seen from the chart below. So excluding the the recent revaluation, the historical precedent would suggest the company is currently trading at half its historical price.
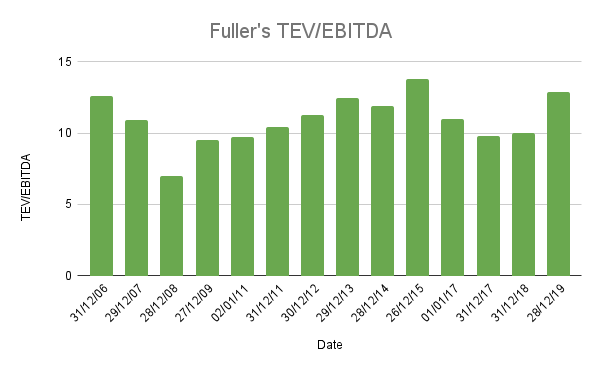
Tangential to book value is TEV/EBITDA, since this is effectively the metric used when calculating the value of the company's estate. You can see from the chart below that Fuller's has historically traded around the same multiples used in the estate valuation (10-12x). Given the EBITDA targets set for FY2024 of £55m-£73m, we can derive an enterprise value of £550m-£730m with a 10x multiple and £660m-£876m with a 12x multiple. The stock currently has a TEV of ~£520m (including lease liabilities), which sits below the lower bound of this range.
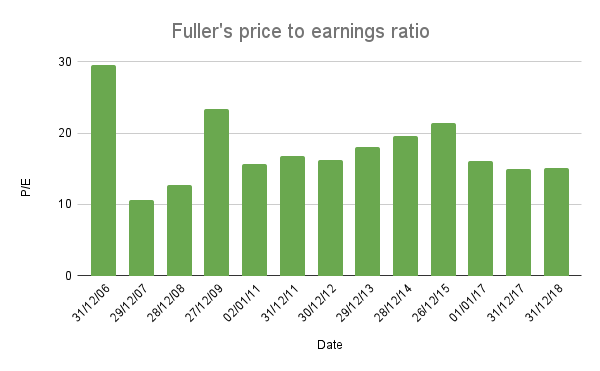
Next we can look at net earnings. The historical P/E multiple for Fuller's has been somewhere around 15x, equating to a 6.7% earnings yield. With the targeted EPS for FY2025 of 49.93p to 60.15p, a 15x multiple would imply a share price of £7.49 to £9.02 in less than 2 years time.
This historical earnings yield chimes with the dividend yield we looked at earlier which has been around 2%, with 2.5x-3.0x cover. With the dividend paid last year of £7.0m, the current yield is 2.2%, and if it returns to the 2019 level of £11.0m, the yield would be 3.5%. If the yield were to revert to historical levels you'd be looking at a market cap of £550m, equating to a share price of £9.06.
The historical earnings and dividend yield is lower than many other UK listed companies, but can in part be explained by the freehold real estate Fuller's has on its balance sheet that derisks the investment to a large degree. There's also the fact that the company has been able to sustainably grow its earnings, and in turn its dividend, by >6% annually with plenty of scope to continue doing so into the future.
One final thing I'll mention is that if you'd bought the stock at its lows at the start of 2009 and held it to the end of 2015, you'd have had a CAGR of 20% on the share price alone. Assuming dividends were reinvested, you'd have quadrupled your initial investment over those 7 years. Looking at the price chart, we could be at another historical low.