Warner Bros. Discovery Research Report
Business overview
Warner Bros. Discovery (WBD) is a leading global media and entertainment company with a portfolio of content and brands across film, television and streaming. It has a presence in over 220 countries and territories, and produces content in 50 different languages.
An incomplete list of its iconic brands and products includes the following: Discovery Channel, Discovery+, CNN, DC, Eurosport, HBO, HBO Max, HGTV, Food Network, OWN, Investigation Discovery, TLC, Magnolia Network, TNT, TBS, truTV, Travel Channel, MotorTrend, Animal Planet, Science Channel, Warner Bros. Pictures, Warner Bros. Television, Warner Bros. Games, New Line Cinema, Cartoon Network, Adult Swim, and Turner Classic Movies.
The business can be broadly divided into three segments: studios, networks, and direct to consumer (DTC). Studios contains the production, release, licensing and distribution of feature films and television programs, with the addition of themed experience licensing and interactive games. Networks encompasses the company's global television networks. DTC includes premium pay TV and digital content services.
The company as it stands today was formed from the merger, on 8 April 2022, of Discovery, Inc. with AT&T's WarnerMedia business. The resultant company is more than 3x larger than Discovery, and as you'd expect for such a merger, is undergoing a costly and uncertain integration process.
Uncertain situations like this can create significant mispricing, that in turn provides an attractive buying opportunity for investors able to look past the short-term turbulence. In this write-up we will explore the question of whether WBD falls into this category, and attempt to separate the risk from the present uncertainty.
The merger
Before exploring the details of the merger, I'll briefly outline the motivations for it as described by the management of Discovery.
The primary attraction is a highly coveted asset portfolio, including many big franchises like Harry Potter, Game of Thrones, DC, and Lord of the Rings, coupled with access to some of the best creative talent in the industry.
Further, there's the potential for a direct to consumer (DTC) product that combines the content libraries of both businesses. HBO Max content is more event-driven - people come to watch specific shows like House of the Dragon, or Succession - but it also has greater churn, as people leave after watching the show that drew them to the platform. Discovery+ on the other hand is much more oriented towards daily viewing, with people often leaving it on in the background while cooking, eating, etc, and it has content for the whole household. A combined content portfolio would have the hit shows that draw people to the product, and also the daily viewing that keeps them subscribed.
Another motivation for the merger was the potential for operational synergies. One such synergy is the use of Discovery's linear TV network to market WarnerMedia content, thus cutting advertising expenses. A second is the consolidation of operations at all levels of management, therefore reducing costs and improving operating margins. In total it was expected that merger synergies would create $3bn of value annually.
The merger was financed by a combination of debt and equity, executed through a Reverse Morris Trust type transaction. This involved the creation of a new company within AT&T (spinco) to hold the WarnerMedia assets and liabilities. Shares in spinco were then issued to AT&T shareholders, which would later be converted to WBD shares on completion of the merger. The eventual ratio was approximately 1 WBD share for every 4 AT&T shares.
The debt component of the merger was arranged as follows. Spinco borrowed a total of $41.5bn, $10.0bn of which came from a Term Loan Facility, and the remaining $31.5bn from the issuance of new Notes. The cash borrowed was used to make a Special Cash Payment to AT&T of $24,443m, followed by an additional payment of $13,000m.
The now leveraged spinco company was then acquired by Discovery through the issuance of new equity. The purchase price paid, based on the distribution of 1,732m new shares at a closing price of $24.43, was $42,376m. Comparing this value to the amount of debt assumed, we can see a fairly equal split between debt and equity financing. The allocation of the purchase price to assets acquired and liabilities assumed from the Q3 10-Q filing is detailed in the table below. A notable component is the $21,862m of goodwill, which is in effect the amount paid over the calculated fair value of the assets minus the liabilities.
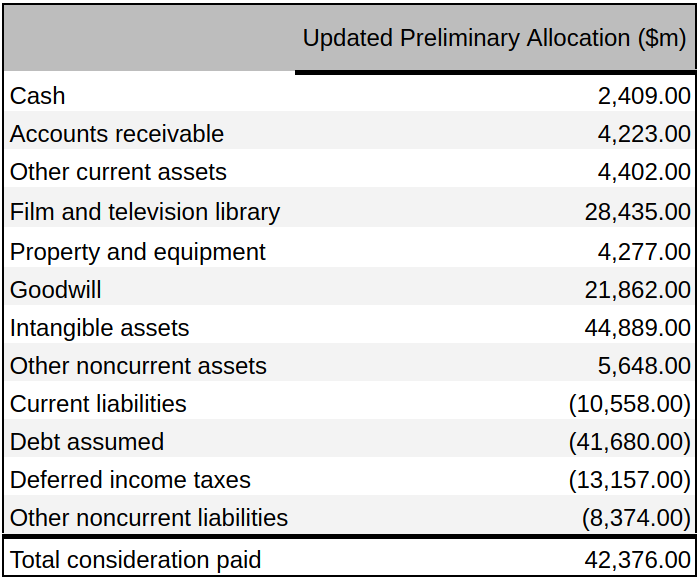
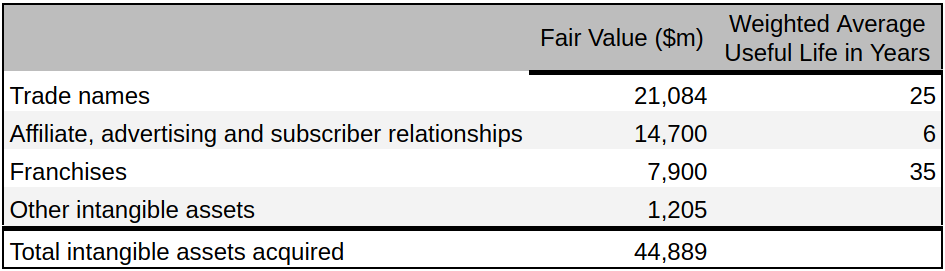
The management also breakdown the intangible assets acquired into a number of components, with estimated fair values and weighted average useful lives, as follows.
Following the merger, AT&T shareholders owned 71% of the combined company and Discovery shareholders 29%.
Something else worth mentioning while on the topic is that this isn't the only major acquisition Discovery has made in recent years. Back in March 2018, the company acquired Scripps which in the year of acquisition represented approximately 55% of Discovery's total assets and 29% of its total revenues. As far as I can tell, Scripps was successfully integrated into Discovery, which bodes well for the latest merger.
Segments
Let's have a look at the business segments in more detail, with reference to the results reported in the Q3 10-Q filing.
Given that the merger occurred on 8 Apr 2022, historical comparison to Discovery financials is in many cases not meaningful. Helpfully, management has given us some Pro Forma Combined figures, which illustrate the hypothetical results had the merger occurred on 1 Jan 2021, but do not account for any potential merger synergies.
Studios
In the nine months ended 30 Sep 2022, the operating results for the studios segment were as follows.
Prior to the merger, Discovery didn't have any studios business worth speaking of, so pretty well all the revenues are attributable to WarnerMedia. Year-over-year, pro forma revenues increased slightly (4% ex-FX) and adjusted EBITDA increased by a substantial 45% (ex-FX) from $1,425m. Operating income turned positive compared to a ($403m) loss the previous year.
As can be seen, the studios segment is fairly break-even at the moment. The task of management is going to be to better exploit the content and improve the efficiency of the operations, so revenues grow and a greater share makes it down to the bottom line. One thing worth mentioning on this point is that it is likely the company is currently making less money licensing its content for internal use in DTC products, than it could by licensing it out to third parties. However, this can be viewed as an investment in the DTC segment, which could eventually pay off if it becomes sustainably profitable.
Another factor is the challenging environment in which the business has operated in recent years. The pandemic has had a large impact on the ability of the studios to produce content and the initial release of feature films in theatres, which is crucial to the overall sales momentum of a film. The business has yet to fully recover from this, but there are twice as many theatrical releases planned for 2023 vs 2022, which is promising.
Networks
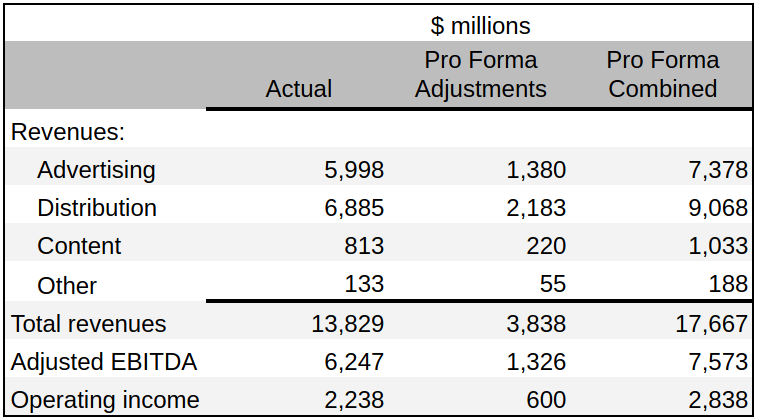
For the networks segment, I think it is useful to look first at the pro forma operating results for the nine months ended 30 Sep 2021, as both Discovery and WarnerMedia generated considerable revenues within this segment.
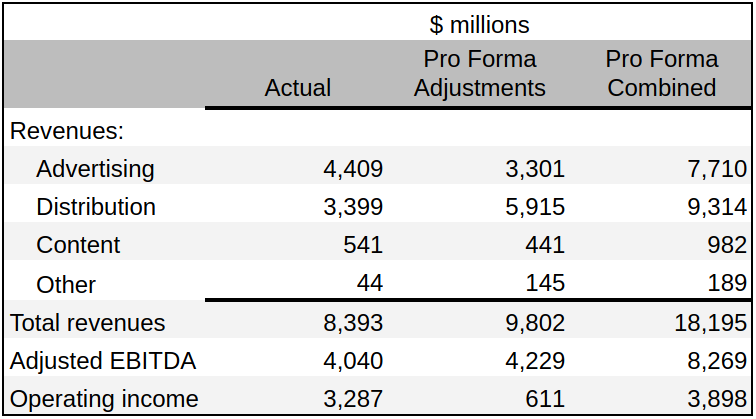
When looking at these results, the Actual column can be translated to Discovery, and the Pro Forma Adjustments column to WarnerMedia. There are a few notable points to draw from these figures. The first is that both businesses produced similar revenues and adjusted EBITDA. We can see however, that a much greater proportion made it down to operating income for Discovery than WarnerMedia. The reason for this is that WarnerMedia recognised much greater depreciation and amortisation ($3,182m vs $794m). We'll see in the 2022 figures that this level of D&A has continued.
The latest results below include nearly two post-merger quarters, so there is not such a clear separation between the Discovery and WarnerMedia business results.
Total revenues, adjusted EBITDA, and operating income all fell year-over-year, with operating income falling the most due to the addition of some restructuring charges not present the year before.
It's also perhaps worth highlighting that the integration of the WarnerMedia business has changed the revenue mix. Previously, advertising was the largest contributor, followed by distribution. Now this has been reversed, with distribution making up a larger proportion of the total.
Despite the results being lower in 2022, the networks segment is still the most profitable in the company, and an important source of cash flows for investment in the other segments.
The anticipation of a gradual decline in revenues from networks, as customers move from traditional cable television to streaming, necessitates investment in alternative sources of income, such as DTC.
DTC
As of 30 Sep 2022, the company had a combined 94.9m core DTC subscribers across its Discovery+, HBO, and HBO Max products. This figure includes both direct retail subscriptions and wholesale subscriptions through third party platforms like Amazon Channels.
Work has been underway since the merger, to create a new product that contains the company's full content library, and realises some of the synergies outlined earlier. This product is on track for release in Spring 2023.
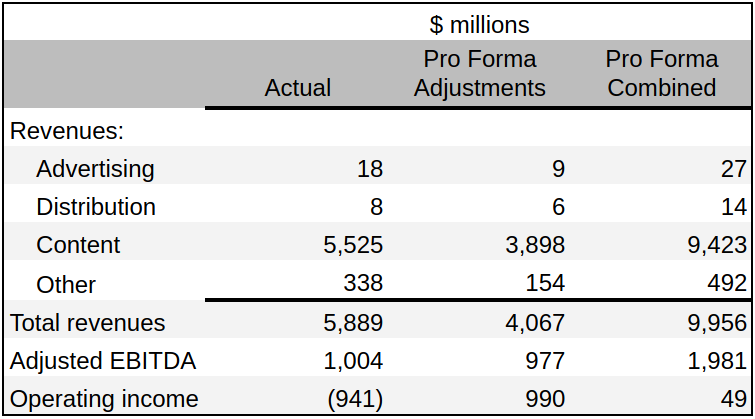
Looking at the results for the nine months ended 30 Sep 2022 below, we can see that the majority of the revenues came from distribution, but all three revenue types grew compared to 2021. Advertising showed the greatest growth on a percentage basis (158%), due to the release of an ad-supported tier in mid-2021.
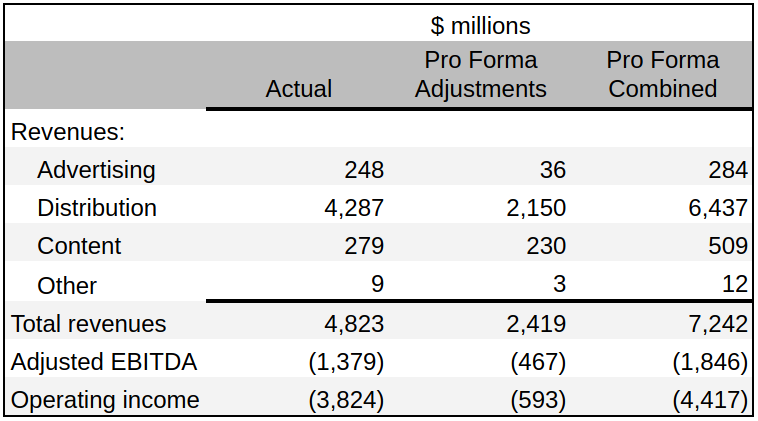
Adjusted EBITDA and operating income were both steeply negative, and declined from the 2021 pro forma combined figures of ($1,137m) and ($2,890m), respectively. The decrease in adjusted EBITDA was due to increased costs of revenues, which outweighed improvements in SG&A costs. The operating loss was further compounded by $989m of restructuring and other charges related to the merger.
The management has said they expect the DTC segment to break-even in 2024 and then generate $1bn in profits globally in 2025. Long-term, they expect the operating margin of the DTC business to be 20%, which largely aligns with those achieved by Netflix.
These target margins are less than those of the current linear business, but the potential product reach is far greater, with the proportion of the global population buying cable subscriptions much less than the proportion streaming content. This reach is further broadened when you add in free-to-view (FTV) and ad-supported tiers for people unwilling or unable to pay for a full subscription. Building and monetising these ad tiers is an area where WBD is likely to excel, due to existing relationships with advertisers through its linear business.
Financials
Before looking at the most recent financials for the combined company, I think it will be constructive to look back at the figures for Discovery and WarnerMedia provided in the merger prospectus. The pre-pandemic results are particularly useful for giving us a picture of the kind of performance we can expect in more normal trading conditions.
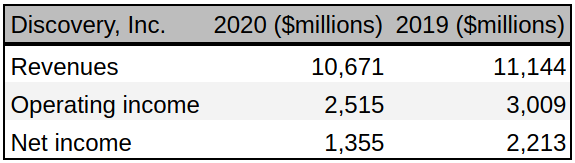
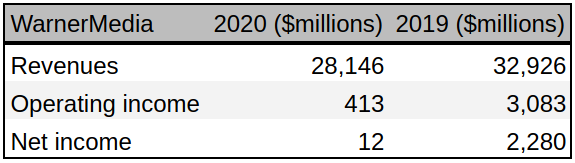
What's striking is that Discovery was producing very similar levels of operating and net income to WarnerMedia, but from one third the revenues. This would suggest that a significant part of the merger synergies envisioned will come from margin improvements in the WarnerMedia business.
There are however differences between the two businesses that make it more complicated than simply replicating the operating practices of Discovery. For example, much of the content shown on Discovery's networks is unscripted and has significantly lower production costs than the scripted content produced by WarnerMedia. Essentially here, you're dealing with higher operating leverage in the WarnerMedia business, which likely means the emphasis is going to be on producing the content that generates the highest revenues, rather than trying to bring down production costs significantly.
Income
Let's move on now to look at the consolidated statements of operations for the nine months ended 30 Sep 2022 from the latest 10-Q. Since the merger only occurred on 8 Apr 2022, and the period covered starts on 1 Jan 2022, it will probably be beneficial to use the pro forma combined figures provided by management, rather than the GAAP figures.
Total revenues came to $32,087m, of which $15,519m was attributable to distribution, $8,215m to content, and $7,651m to advertising. This is slightly down on the total revenues for the same period in 2021 of $32,913m.
Total costs and expenses were $36,309m, with $19,357m coming from costs of revenues, $8,900m from sales, general and administrative, $5,536m from depreciation and amortisation, and $2,469m from restructuring and other charges. This was an increase on the previous year total of $34,443m, attributable to increased costs of revenues and the restructuring charges following the merger.
Subtracting these costs and expenses from total revenues gives us an operating loss of ($4,222m) vs ($1,530m) the previous year. Without the pro forma adjustments, the operating loss figure was ($5,476m) vs an operating profit of $1,504m in 2021. The GAAP figure is lower due to a $1,254m operating profit achieved by the WarnerMedia business in the months prior to the merger.
The net loss for WBD calculated using the GAAP operating loss figure was ($5,218m) vs a net profit of $1,106m in 2021 (attributable only to Discovery). This includes the subtraction of $1,219m in net interest expense, counterbalanced by $1,201m in income tax benefit.
As a result of the substantial amount of debt assumed through the merger, the net interest expense figure has increased significantly. This is illustrated by comparing the third quarter net interest expense for 2022 of $555m to the 2021 figure of $159m. On an annual basis, we can expect net interest expense to exceed $2bn.
Another figure used internally by management to assess the underlying performance of their operations is adjusted EBITDA, which is calculated by subtracting cost of revenues and SG&A expenses (excluding share based compensation and third-party transaction and integration costs) from total revenues. This came to $5,115m for the nine months ended 30 Sep 2022 vs $2,680m in 2021.
Management has given their expectation for adjusted EBITDA to be $12bn for FY 2023, with $4bn-$6bn of this being translated to free cash flow. This was with the caveat that it will depend on the strength, or lack thereof, of the advertising market. I would expect a significant portion of this adjusted EBITDA figure to come from merger synergies, now anticipated to be in the range of $3bn-$3.5bn, with the realisation of $2bn in 2023.
Balance sheet
Let's now progress to look at the consolidated balance sheets as of 30 Sep 2022.
Current assets were $12,672m, consisting of $2,422m in cash and cash equivalents, $6,669m in receivables, and $3,581m in prepaid expenses and other assets.
Set against this were current liabilities amounting to $14,676m, composed of $1,534m accounts payable, $10,197m accrued liabilities, $1,688m deferred revenues, and $1,257m attributable to the current portion of debt.
Notably, these current liabilities exceed the current assets, with a current ratio of 0.86 compared with 2.10 on 31 Dec 2021. Looking back at the WarnerMedia accounts for 30 Sep 2021, we can see a similarly poor current ratio of 0.84, so it appears to be a feature of the WarnerMedia business rather than Discovery.
While there may be some seasonality to these figures, it's still a cause for concern with regards to liquidity. Looking back at the quarterly financials of Discovery and some of its competitors, you can see a current ratio in excess of 1 is maintained throughout the year. I would therefore expect management to move back to this policy soon.
Total assets were $136,049m, with intangible assets and goodwill making up the majority of this at $46,744m and $34,450m, respectively. Film and television content rights and games contributed a further $28,288m. While there's undoubtedly a lot of intangible value in the WarnerMedia assets, I don't think we can say they're immune to impairment. There has already been a significant amount since the merger, as the management has re-evaluated the value of the assets acquired. In addition, there isn't much in the way of tangible assets to sure up the balance sheet, with only $5,143m of property and equipment.
Total liabilities were $85,969, with the non-current portion comprising debt of $48,612m, deferred income taxes of $12,317m, and other liabilities of $10,364m. Subtracting these liabilities (and redeemable non-controlling interests) from the assets, gives us total equity of $49,762m, of which $48,517m is attributable to WBD shareholders.
From these figures we can calculate the debt to equity ratio as ~100%. This figure is not exceptionally large and is comparable to many other companies, including Discovery pre-merger (113%). The sustainability of a debt level like this depends on the stability of earnings, which is why you commonly see a lot of leverage on the balance sheets of utilities companies providing essential services like water and electricity.
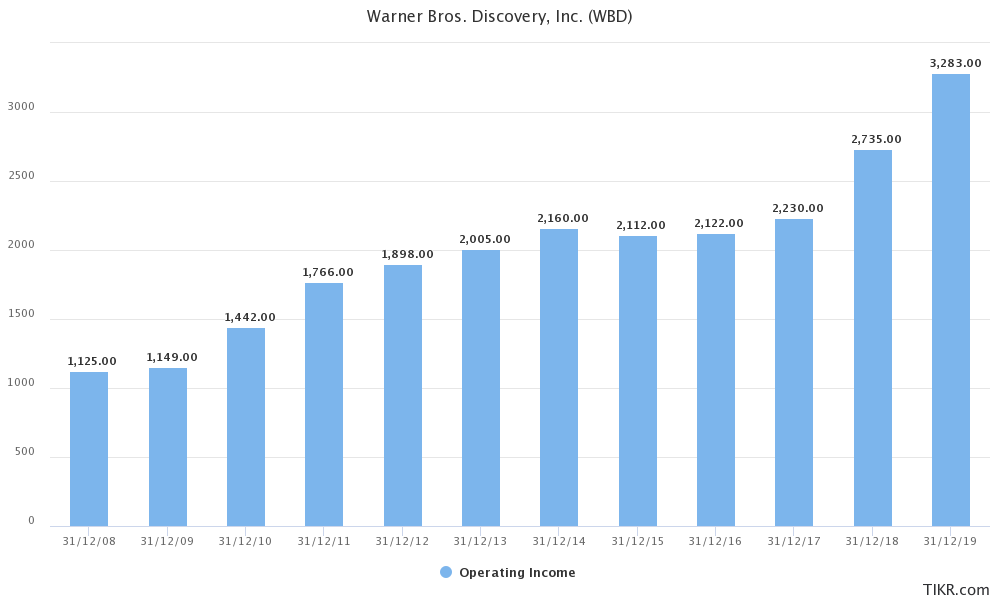
Historically, Discovery's business has produced relatively stable earnings as shown in the chart below. The management has also expressed their intention to bring the leverage ratio (calculated as net debt divided by adjusted EBITDA) down to below 3:1 within the next 18 months. In addition, they are bound by their debt covenants to maintain interest cover of at least 3:1, and a leverage ratio less than 5:1 by the first anniversary of the merger, decreasing to 4.5:1 by the second anniversary.
The following table breaks down the debt by maturity and type, and includes the weighted-average interest rate for each group. In aggregate, the company's debt had an average maturity of 14 years and an average interest rate of 4.2% as of 30 Sep 2022.
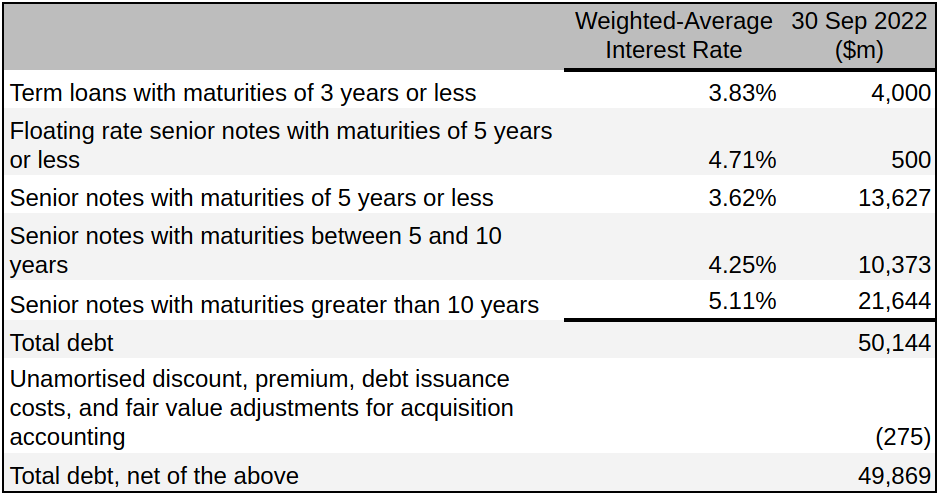
The company also has access to an additional $6bn through a Revolving Credit Agreement, which is restricted by the covenants outlined above. As of 30 Sep 2022, this credit facility was undrawn and management has stated that they are in compliance with all debt covenants. The leverage ratio of 5.1:1, calculated with adjusted EBITDA for the trailing twelve months (TTM), would agree with this statement. But I'm not sure how they've calculated the interest cover to make it comply, since the company has reported an operating loss for the previous nine months. Given that net interest is likely to be ~$2b for the full year, you'd expect the operating income to need to be $6bn or greater. We'll have to see whether this statement of compliance changes in the annual report.
Cash flow
As stated earlier, the net loss for the nine months ended 30 Sep 2022 was ($5,218m). Reconciling this to cash provided by operations of $1,458m (2021: $1,914m) required the following notable adjustments: the addition of $11,441m for content rights amortisation and impairment, and $5,024m for general depreciation and amortisation; the subtraction of ($2,105m) for deferred income taxes, and ($8,612m) spent on film and television content rights, games, and net payables.
As we can see, a lot was spent on content during this period, which aligns with management's statement that theatrical releases will double in 2023. However, the figure was still substantially less than the the total amortised and impaired, much of which was hidden in costs of revenues on the income statement. This reflects the fact that quite a number of production projects were cancelled after the merger, following management's "strategic content programming assessments" - which I interpret to mean: they're cutting anything that doesn't meet certain expected profitability thresholds.
Cash provided by investing activities came to $3,742m, largely due to $3,609m acquired through the WarnerMedia merger. A further $722m came from the proceeds of derivative instruments, offset against $623m spent on purchases of property and equipment.
Cash used in financing activities came to ($6,470m), primarily attributable to $6,000m of term loan repayments. There was also the $885m issuance and repayment of commercial paper, presumably rolling over a previous borrowing.
Adding the cash flows from operating, investing, and financing activities together gives a net change in cash, cash equivalents, and restricted cash of ($1,392m) vs $1,004m in the same period of 2021. This left $2,513m of cash, cash equivalents, and restricted cash at the end of the period.
As stated earlier, management expects free cash flow (FCF) to be in the range of $4bn-$6bn for 2023, equating to 33%-50% of adjusted EBITDA. Longer term, they are targeting 60% conversion of adjusted EBITDA to FCF. If all goes according to plan with their merger synergies and DTC becomes profitable in 2025, you could be looking at adjusted EBITDA somewhere around $15bn, which would translate to ~$9bn in FCF at their target conversion ratio.
Management
The company's President and CEO is David Zaslav, who has led the company since 2006. Over his tenure, the company has grown substantially in size and profitability through a combination of organic growth and acquisitions. Prior to joining Discovery, David played an instrumental role in developing and launching CNBC at NBCUniversal.
David has also benefited from the guidance of John Malone of The Outsiders fame, Chairman of Liberty Media, Liberty Broadband and Liberty Global, who has served on the board of Discovery since 2008, and holds a significant stake in the company - worth close to $300m.
As part of the merger, AT&T appointed seven board members including Chairman Samuel Di Piazza, former CEO of accounting firm PWC.
The remaining board members were appointed by Discovery, and include Steven Miron and Steven Newhouse, who are both affiliated with WBD's largest shareholder: Newhouse Broadcasting Corporation.
It's good to see board members with significant stakes in the company, as this creates alignment between the interests of shareholders and management. On this subject, it's also worth mentioning that David Zaslav currently holds shares in the company worth just under $60m.
Another positive I've taken from listening to the company's quarterly earnings calls and reading transcripts from interviews with members of the executive team, is a focus on free cash flow generation in all of their business segments. This is encouraging, especially with DTC, which has historically been a business subject to a growth at all costs mentality.
Executive compensation
David Zaslav receives a base salary of $3m, which is fixed under a new employment agreement until 31 Dec 2027. In addition to this he receives a target annual bonus of $22m, dependent on meeting certain quantitative and qualitative targets which are re-evaluated yearly. If these targets are exceeded, then he is eligible to receive up to 125% of this target bonus.
These cash based payments represent a relatively small part of the overall compensation package, with the remainder coming in the form of equity. One part of this is the issuance of $12m in performance restricted stock units (PRSUs), which are bound by the same performance targets as the cash bonus. The largest component however, comes from stock options amounting to $202,889,764. These are spread out over the duration of the contracted employment period ending 31 Dec 2027 and have exercise prices starting from $35.65 and increasing in tranches to $43.33.
While this is undeniably a very large amount of compensation, all but the base salary of $3m is linked to performance, and the stock options are worthless unless the stock price more than doubles from its current value of ~$15. This creates substantial alignment of interests between the CEO and shareholders.
The other executives have a similarly performance-focused compensation structure, but with much smaller option awards, and individually their total compensation is less than 10% of David Zaslav's.
Risks
There are quite a few short-term macro risks to which the company is exposed, with varying degrees of likelihood and impact. Examples include a general slowdown in the advertising market, a pandemic resurgence resulting in more lock-downs, and a recession that reduces consumer appetite for discretionary spending.
A slowdown in the advertising market would undoubtedly be negative for the company, since it currently relies on advertising through its networks to generate a substantial portion of its profits. This would also be likely to slow the progress towards profitability of the DTC segment, as a significant part of their strategy revolves around ad-supported and free-to-view tiers.
It is likely that an advertising slowdown would coincide with a general economic slump, and so the company may also have trouble monetising their content in other ways.
A resurgence of the pandemic is hopefully the least likely scenario, but the impacts would probably be mixed. Production and theatrical release would be hit, but DTC could receive a boost as we saw in 2020/2021.
In the long run these factors are probably inconsequential, provided they don't effect the company's ability to make interest and principle payments on its debt.
Debt is one of the key risks we need to consider, and the next few years are going to be critical as they will be the period of peak leverage. Essentially, it's going to be a matter of generating sufficient cash flow to service and reduce the debt burden. Here though, the management has quite a few levers they can pull.
Right now they're pouring a lot of cash into the DTC segment, not only through development and marketing, but also through exclusive content that could otherwise be licensed to third-parties. Removing the exclusivity of this content is a way they could generate some cash if necessary.
This is just one example, but with such a large and diversified business, you've got a lot of options.
Here we've touched on another potentially major risk, which is that the investment in DTC doesn't pay off and it never becomes profitable. In the balance of probabilities I find this unlikely given the strength of the company's IP assets. However, if this were to happen, you'd still have the studios which are likely to endure, and the networks, which despite a forecast of gradual decline, are likely to remain profitable for many years to come.
It also bears mentioning with regard to the long-term success of the company, that there are a number of people internally who are highly motivated for it to succeed, not least the CEO. This gives me some faith that they will deliver.
Valuation
As discussed earlier, management expects FCF for FY 2023 to be in the range of $4bn-$6bn. You could conservatively put a 10x multiple on this and say the company should be valued between $40bn-$60bn, which would be greater than the current market capitalisation of ~$37bn. In share price terms, this would put you between $16-$25 vs the current ~$15.
Realistically though, this significantly undervalues the company as illustrated by the minimum exercise price on David Zaslav's share options of $35.65. There are a lot of variables, but if we assume the merger synergies generate the expected $3bn-$3.5bn and the DTC segment becomes profitable on schedule, an $8bn-$9bn FCF figure seems quite reasonable within a few years. On the 10x FCF basis, this would put the value of the company at $80bn-$90bn or $33-$37 per share.
If all the DTC business does in the long-run is replace the networks, then you might not see much growth beyond this. But if it fulfils its promise and expands the addressable market of the company, there could be substantial upside. In this case, it is also unlikely that the company would trade on the lowly 10x FCF multiple I've used in my calculations.
Putting all this together, the company seems attractively valued at present and could generate very substantial returns for shareholders in the coming years. I would not be put off by the fact the stock has risen 50% since the start of the year; there's still plenty of upside to capture from here.